Natimortality
Languages
- English
- Português
- Español
Mature – 1,3% (231)
Premature – 13% (132)
General population – 2,4% (419)
Infant Mortality Coefficients by Regions
Brazil 1980 - 1990 - 1996
|
Regions |
1980 |
1990 |
1996 |
Variation 80-90 |
Variation 90-96 |
|
Brazil |
85,6 |
47,8 |
37,5 |
-44,1% |
-21,5% |
|
North |
83,6 |
44,6 |
36,1 |
-46,6% |
-19,5% |
|
Northeast |
120,5 |
74,3 |
60,4 |
-38,3% |
-19,1% |
|
Southest |
61 |
31,2 |
25,9 |
-48,8% |
-6,9% |
|
South |
55,5 |
27,6 |
22,9 |
-50,2% |
-17% |
|
Midwest |
66,4 |
31,2 |
25,8 |
-53% |
-22,8% |
Source: Sistema de Informação de Mortalidade/MS. Cálculo de Celso Simões (IBGE)
Perinital Mortality Rate by Regions of the World - 1996
|
Region |
Estimation of Perinatal Mortality by 1000 NV (1993) |
Estimation of Perinatal Mortality by 1000 NV (1995) |
|
World |
58 |
53 |
|
Africa |
81 |
75 |
|
Asia |
61 |
53 |
|
Europe |
14 |
13 |
|
Latin America |
54 |
39 |
|
North American |
13 |
9 |
|
Oceania |
52 |
44 |
Source: OMS, Perinatal Mortality, 1996, P.4
Percent Distribution and Mortality Coefficient by Age of Deaths Under 1 Year
Brazil 1990 - 1996
|
Years |
< 1 dia to 6 days |
7 to 27 days |
28 to < 1 year |
Total |
||||||
|
|
Nº |
% |
CMI |
Nº |
% |
CMI |
Nº |
% |
CMI |
* |
|
1990 |
35.876 |
37,5 |
17,9 |
11.017 |
11,5 |
5,5 |
48.583 |
50,8 |
24,3 |
95.476 |
|
1991 |
34.904 |
40,5 |
18,3 |
10.108 |
11,8 |
5,3 |
40.431 |
47,3 |
21,3 |
85.443 |
|
1992 |
33.474 |
39,7 |
17 |
9.213 |
10,9 |
4,7 |
41.639 |
49,3 |
21,2 |
84.326 |
|
1993 |
34.040 |
38,8 |
15,9 |
9.781 |
11,1 |
4,5 |
43.772 |
49,9 |
20,5 |
87.593 |
|
1994 |
35.683 |
41,1 |
16,2 |
9.728 |
11,2 |
4,4 |
41.286 |
47,6 |
18,8 |
86.697 |
|
1995 |
36.403 |
44,7 |
17,2 |
9.594 |
11,8 |
4,5 |
35.300 |
43,2 |
16,5 |
81.297 |
|
1996 |
35.046 |
46,9 |
17,6 |
8.984 |
12 |
4,5 |
30.678 |
41,1 |
15,4 |
74.711 |
* Less deaths with unknown age
Source: Sistema de Informação de Mortalidade SIM / CNEP / FNS / MS
Main Causes of Neonatal Mortality
Brazil 1990 - 1992 - 1996
|
Causes |
1990 |
1992 |
1994 |
|||
|
Nº |
% |
Nº |
% |
Nº |
% |
|
|
Diarrhea |
1.140 |
2,4 |
654 |
1,6 |
594 |
1,3 |
|
Pneumonia |
1.774 |
3,7 |
1.544 |
3,6 |
1.419 |
3,1 |
|
Perinatal Conditions |
33.851 |
72,2 |
30.934 |
72,5 |
34.383 |
73,2 |
|
Congenital Anomalies |
4.068 |
8,7 |
4.173 |
9,7 |
4.699 |
9,9 |
|
Other Causes |
3.208 |
6,8 |
3.047 |
7,1 |
3.137 |
6,6 |
|
Poorly Defined Causes |
2.852 |
6,1 |
2.335 |
5,5 |
1.765 |
4,0 |
|
Total |
46.893 |
100 |
42.687 |
100 |
45.997 |
100 |
Neonatal Deaths from Perinatal Conditions (Major Causes)
Brazil 1990 - 1995
|
CAUSES |
1990 |
1992 |
1995 |
|||
|
Nº |
% |
Nº |
% |
Nº |
% |
|
|
Other Respiratory Distress |
8.917 |
26,3 |
8.729 |
26,0 |
9.876 |
28,7 |
|
Hyaline Menbrane Disease |
6.103 |
18 |
6.458 |
19,3 |
7.196 |
21 |
|
Prematurity and Low Birth Weight |
5.430 |
16 |
5.043 |
15,0 |
4.434 |
13 |
|
Specific Infection in the Perinatal Period (except Tetanus) |
3.781 |
11,2 |
3.698 |
11,0 |
4.378 |
12,7 |
|
Hypoxia Asphyxia |
4.197 |
12,4 |
3.794 |
11,3 |
3.702 |
11.7 |
|
Other Causes |
1.904 |
5,6 |
2.938 |
8,8 |
4.797 |
14,0 |
|
Other Malignant Disorders |
3.519 |
10 |
2.849 |
8,5 |
2.947 |
9 |
|
TOTAL |
33.851 |
- |
33.509 |
- |
37.330 |
- |
Source: Sistema de Informação de Mortalidade SIM / CNEP / FNS / MS
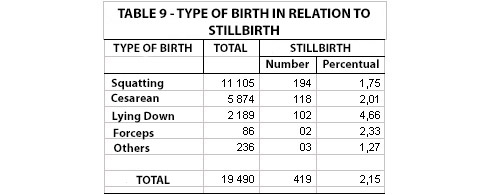
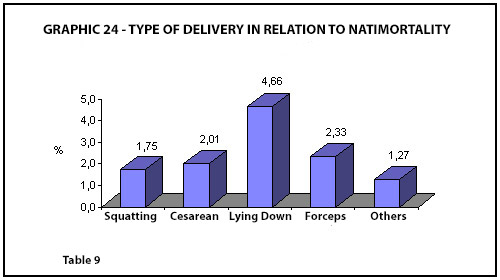
NATIMORTALITY AND TYPE OF BIRTH
Congenital Defects
It occurred in the proportion of 1:152 and the most frequent occurance is classified as malformation, followed by congenital cardiopaty, rocker bottom feet, acetabular dysplasia, cleft lip palate, hydrocephaly, anencephaly, mielomeningocelis, Down’s syndrome, and others.
Mothers Mortality
Mothers mortality happened in the proportion of 51 per 100.000 cases of alive newborns.
C-section: bleeding (1), eclampsy (2), peritonitis (1), premature rupture of membranes (1)
Peridural anesthesia previous to C-section (1).
Squatting position: heart failure in patient who had heart surgery before (1), lung emboly (1)
Forceps delivery: heart failure after forceps and labor induction (1)
First stage: non accurate diagnosis (1)
The present mother’s mortality rate is a little bit under the rate showed by Faundes (1979-1983) of 57: 100.000 in Campinas, and it is a sixth part of the rate showed by Belfort (1960-1983) of 315: 100.000 at Santa Casa da Misericórdia do Rio de Janeiro.
Conclusion
There have been many problems during this work which are peculiar to it and problems which are related to what happens in our country. Watching the results herein, we realize they are the results in the medical literature.
Other aspects are under the Brazilian average levels, such as: C-section occurrence, forceps, labor induction, utilization of tranquilizers, etc…
We should ask what can the difference be imputed to.
And in the answer first paragraph will appear the position of delivery which encourages mother’s participation and consciousness of whom participates in the process.